In the last year I have been part of the team maintaining and updating the Network of Cancer Genes database, also known as NCG.
The main focus of NCG is to provide a curated list of genes associated to cancer, obtained after a manual review of the literature, and classified by cancer subtypes. Moreover NCG annotates some system-level properties of genes associated to cancer, from their protein interactions to their evolutionary age, and from the presence of paralogs in the human genome to their function.
NCG is a small database and is not supported by any big consortium, but we do our best to fill our niche :-). The following list will describe you what you can get from NCG and how can it be useful to you.
A manually annotated list of genes associated to cancer
It is difficult to keep pace with all the literature on cancer. New screenings on cancer samples are published every one or two months, usually describing novel mutations and new cancer driver genes. While these screenings add important knowledge on the mechanisms behind cancer, it is difficult to keep track of all of them, and have a clear picture of which mutations are driver in a given cancer type. The ICGC and the TCGA consortia provide some nice web interface to retrieve the genes recurrently mutated in a cancer type, but these are limited only to the data published by these two consortia. What about all the other studies published outside of ICGC and TGCA?

In NCG we manually review all the studies published recently, and annotate a list of genes reported as “drivers” in each study. So far we have about 70 papers annotated, and we are close to uploading a batch of about 70 more publications. The annotation process is currently done between three people, and each paper is checked more than once to make sure that the annotation is correct. It’s hard work, but then the output is a nice list of driver genes in each cancer type.
Annotation of paralogs of cancer genes
Recent estimates reported that about 80% of the human genes have at least one paralog (e.g. Dickerson and Robertson 2012). These percentages may be a bit too high, and they may be based on a excessively broad definition of paralogy, but overall we can expect that a good portion of the human genes have at least a domain or a portion of their sequence in common with other genes.

The presence of a paralog of a cancer gene is a factor to take into account, because it can complicate the development of drug strategies. In particular, it has been hypothesized that two paralogs can often exibit functional compensation, meaning that if we inhibit the activity of a gene, the other paralog can compensate the function, reducing any impact of the inhibition. This may render a drug less efficient in inhibiting an oncogene, or lead to unpredictable effects in other cases.
Annotation of gene age
It has been shown that cancer genes of different age can have different properties. For example most tumor suppressors tend to be old genes originated in the Universal Common Ancestor of all eukaryotes, while most oncogenes are originated in metazoans. The indication of gene age can therefore be useful to have an idea of whether a candidate gene may be an oncogene or a tumor suppressor.
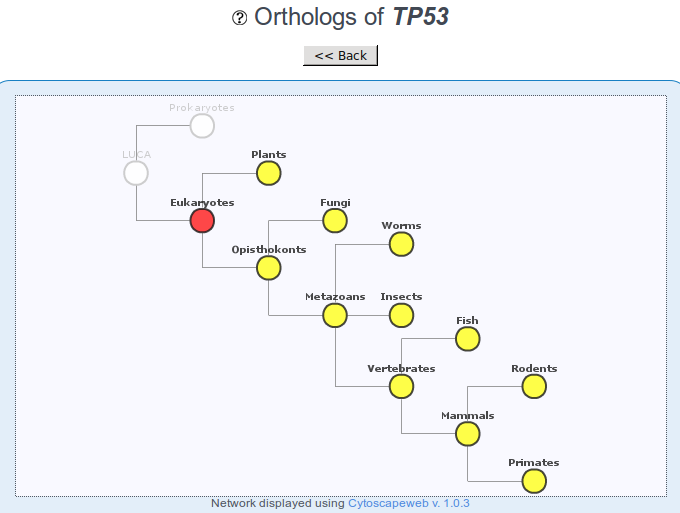
The indication of age can also be useful to understand which model organisms can be used to study the gene – e.g. whether the gene is present in yeast, or only in closer species.
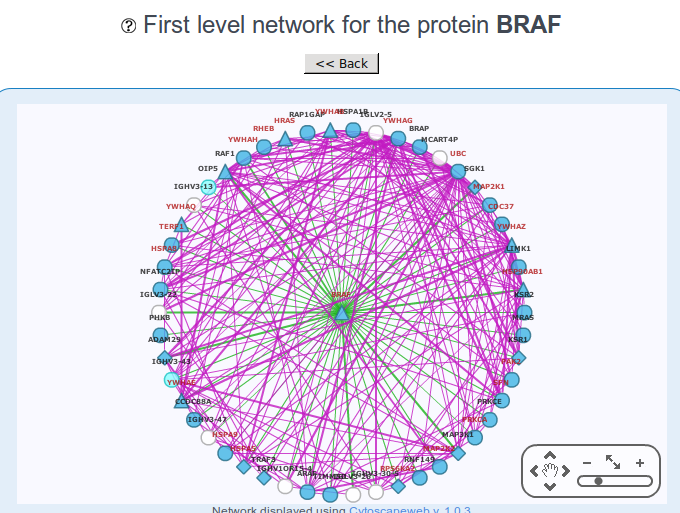
Role in the interactome network
Another important feature provided in NCG is the protein-protein interactions of the cancer gene. It has been reported that both oncogenes and tumor suppressor genes have on average an high number of interactions, so understanding which genes interact with a given candidate can be useful to understand the function and the involvement in cancer. The interaction network in NCG comes from the integration of 5 databases for protein-protein interactions (see An et al 2014 for more info), after some cleaning steps.
Summary
NCG is database annotating cancer genes and their systems-level properties. It is now at the 4th release, but its development is still active and we are looking for new properties to annotate. If you have any idea or suggestion, just contact us!
References (cross linked at researchblogging.org)
An, O., Pendino, V., D’Antonio, M., Ratti, E., Gentilini, M., & Ciccarelli, F. (2014). NCG 4.0: the network of cancer genes in the era of massive mutational screenings of cancer genomes Database, 2014 DOI: 10.1093/database/bau015
Dickerson, J., & Robertson, D. (2011). On the Origins of Mendelian Disease Genes in Man: The Impact of Gene Duplication Molecular Biology and Evolution, 29 (1), 61-69 DOI: 10.1093/molbev/msr111
This a great resource. Can I incorporate the data into DOSE package?
Hi Guangchuang, I think it will be definitely very cool!!
The best way to get the list of genes is from the Download section (http://ncg.kcl.ac.uk/download.php). There are two types of cancer genes: “cgcs”, derived “candidates”, which are the Cancer Gene Consensus (http://cancer.sanger.ac.uk/cancergenome/projects/census/ ), and “candidates” , derived from our manual curation of terms. In addition, cgcs are divided into either “dominant” and “recessive” genes, according to whether they are oncogenes or tumor suppressors.
The list of genes is a bit old, as it is frozen since 2014. We are going to update the list at the end of the year, but it is not ready yet at the moment ;-)
Thank you.
As most of the genes are candidate, I will ignore these divisions at the currently stage.
Sounds good! Let me know if you need any other info :-)
> require(DOSE)
Loading required package: DOSE
> data(geneList)
> gene = names(geneList)[abs(geneList)>2]
> head(gene)
[1] “4312” “8318” “10874” “55143” “55388” “991”
>
> y = gseAnalyzer(geneList, setType=”NCG”)
[1] “calculating observed enrichment scores…”
[1] “calculating permutation scores…”
|================================================================== | 95%
[1] “calculating p values…”
[1] “done…”
>
> head(summary(y))
[1] ID Description setSize enrichmentScore
[5] pvalue p.adjust qvalues
(or 0-length row.names)
> y = gseAnalyzer(geneList, setType=”NCG”, minGSSize=1)
[1] “calculating observed enrichment scores…”
[1] “calculating permutation scores…”
|===================================================================== | 98%
[1] “calculating p values…”
[1] “done…”
> head(summary(y))
ID
breast,lung,ovarian,pancreas,prostate,sarcoma breast,lung,ovarian,pancreas,prostate,sarcoma
liver liver
Description
breast,lung,ovarian,pancreas,prostate,sarcoma breast,lung,ovarian,pancreas,prostate,sarcoma
liver liver
setSize enrichmentScore pvalue
breast,lung,ovarian,pancreas,prostate,sarcoma 2 -0.9965348 0.000
liver 59 -0.4762949 0.001
p.adjust qvalues
breast,lung,ovarian,pancreas,prostate,sarcoma 0.000 0.00000000
liver 0.031 0.02631579
>
> x = enrichNCG(gene, pvalueCutoff=1, qvalueCutoff=1, minGSSize=1, readable=TRUE)
> head(summary(x))
ID Description GeneRatio BgRatio pvalue p.adjust qvalue
prostate prostate prostate 2/17 80/1920 0.1559174 0.1559174 NA
geneID Count
prostate FOXA1/OGN 2
Now DOSE supports hypergeometric test and GSEA for NCG data.
FYI, thanks to enrichNCG, now clusterProfiler supports annotation data from user input. https://github.com/GuangchuangYu/clusterProfiler/commit/b553212e19ffd57da762774ff9404583287e2b84.
These are wonderful news! Thank you for implementing NCG in DOSE! I’ll write a blog post as soon as I can.
How does the custom annotation data works? Does it allow to create custom databases of genes/terms annotations?
User only needs to provides TERM2GENE annotation, which is a data.frame with 2 columns. The first column is term and the second one is gene.
Another input TERM2NAME is optional.
Other parameter is similar with enrichGO/enrichKEGG.
For example:
> require(DOSE)
> data(geneList)
>
> require(clusterProfiler)
>
> gsea.res =GSEA(geneList, minGSSize=1, pvalueCutoff=1, TERM2GENE=cancer2gene)
preparing geneSet collections…
[1] “calculating observed enrichment scores…”
[1] “calculating permutation scores…”
|===================================================================== | 98%
[1] “calculating p values…”
[1] “done…”
>
> head(summary(gsea.res))
ID
breast,lung,ovarian,pancreas,prostate,sarcoma breast,lung,ovarian,pancreas,prostate,sarcoma
liver liver
leukemia,breast leukemia,breast
ovarian ovarian
lymphoma,non-hodgkin lymphoma lymphoma,non-hodgkin lymphoma
lymphoma lymphoma
Description
breast,lung,ovarian,pancreas,prostate,sarcoma breast,lung,ovarian,pancreas,prostate,sarcoma
liver liver
leukemia,breast leukemia,breast
ovarian ovarian
lymphoma,non-hodgkin lymphoma lymphoma,non-hodgkin lymphoma
lymphoma lymphoma
setSize enrichmentScore pvalue
breast,lung,ovarian,pancreas,prostate,sarcoma 2 -0.9965348 0.000
liver 59 -0.4762949 0.001
leukemia,breast 2 0.9732172 0.004
ovarian 2 0.9473503 0.010
lymphoma,non-hodgkin lymphoma 12 0.6290415 0.014
lymphoma 119 0.3043574 0.017
p.adjust qvalues
breast,lung,ovarian,pancreas,prostate,sarcoma 0.00000000 0.00000000
liver 0.03100000 0.02684211
leukemia,breast 0.08266667 0.07157895
ovarian 0.15500000 0.13421053
lymphoma,non-hodgkin lymphoma 0.17222222 0.14912281
lymphoma 0.17222222 0.14912281
>
> gene = names(geneList)[abs(geneList) > 1]
> enrich.res = enricher(gene, minGSSize=1, pvalueCutoff=1, qvalueCutoff = 1, TERM2GENE=cancer2gene)
> head(summary(enrich.res))
ID Description GeneRatio
liver liver liver 12/160
lipoma lipoma lipoma 2/160
gastric gastric gastric 5/160
bone cyst bone cyst bone cyst 2/160
cholangiocarcinoma cholangiocarcinoma cholangiocarcinoma 2/160
non-hodgkin lymphoma non-hodgkin lymphoma non-hodgkin lymphoma 3/160
BgRatio pvalue p.adjust qvalue
liver 79/1920 0.02738473 0.2624927 0.2302567
lipoma 4/1920 0.03701728 0.2624927 0.2302567
gastric 24/1920 0.04374878 0.2624927 0.2302567
bone cyst 5/1920 0.05835422 0.2625940 0.2303456
cholangiocarcinoma 6/1920 0.08282484 0.2981694 0.2615521
non-hodgkin lymphoma 18/1920 0.18465912 0.4928293 0.4323064
geneID
liver 727897/273/1657/4337/29994/4053/2550/4915/213/3572/80162/4857
lipoma 57007/10186
gastric 7272/1272/79633/5764/9723
bone cyst 1009/4958
cholangiocarcinoma 10403/3908
non-hodgkin lymphoma 7037/7832/4582
Count
liver 12
lipoma 2
gastric 5
bone cyst 2
cholangiocarcinoma 2
non-hodgkin lymphoma 3
These examples using GSEA and enricher with user input (NCG data here).
enrichNCG() and gseaAnalyzer(setType=”NCG”, …) will generate the same output.
You may notice that Description and ID columns are the same, since we did not provide TERM2NAME data.frame, and the Description is necessary for plotting (ID is supposed for computer and Description for human).
So, if there is no TERM2NAME annotation available, I just put the ID in Description column.
GSEA and enricher is only available in clusterProfiler.
I will keep all the functions in DOSE are all disease related.