Today, in the metro, I have finally understood what is the form of a genotype space.
A genotype space is a representation of all the possible genotypes that can possibly exist, and in which two neighbor points are different only for one single mutation (Hamming distance is 1).
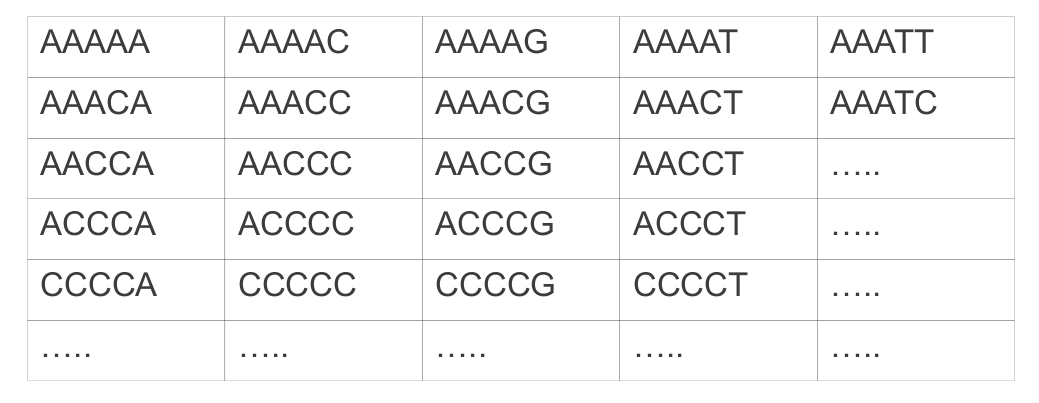
Until now, in the book club slides, I represented it as a matrix:

However, this representation has many flaws… it should be at least a multi-dimensional matrix, since each node should have exactly n neighbors (where n is the length of the genotype), while in a matrix they can have only 4 (or 8 if you count diagonals).
So, a better representation of the genotype space is a graph, like the following:

In this graph, the “genotype” of an organism is a chromosome composed by only 5 bases, and in which each base can take only two values. Each node is connected only to the nodes that differ by a single position; for example, “00000” is connected to “10000”, “01000”, “00100”, “00010” and “00001”. Thanks to “jts” from Biostar, now I also know that this is an Hamming graph H(5, 2).
Now that we have a representation of the genotype space, we can take any phenotype of our interest, and mark it in the genotype space. For example, imagine that all the genotypes in green correspond to individuals that suffer a congenital disease:

The genotypes in green correspond to what A. Wagner calls “genotype network”, and other authors call “neutral network”. It is a set of genotypes that have the same phenotype, and that are connected by at least one change.
By exploring the topology and structure of a genotype network, we may be able to make some nice observations. For example, how big is the genotype network of a congenital disease, in human populations? Or, how can a population of individuals explore a genotype network?
There are really a lot of questions that come to my mind when looking at these representation. So, it is a good time for me to search on new literature!! 🙂
note: I wrote a small python script to generate a Hamming Graph of binary strings. Here it is: https://gist.github.com/1854319
this is very interesting. the completely understand of this can help make better programs for molecular docking.
thanks for sharing these reflections. I was obsessed with the same problem applied to a different biological object:: soybean varieties and a molecular definition of them I believe the conclusion about the possibility of making better programs to handle this kind of mathematical objects.