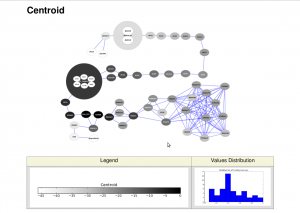
Finally I have made it: scripting and automatizing Cytoscape with python!! Below you can see a figure that I have automatically generated with Cytoscape, including legend and values distributions merged into a single file:

Cytoscape is a software to visualize and analyze networks, widely adopted by the bioinformatics community and with a lot of plugins to analyze biological data. Unfortunately for me, it is written in Java, making it a lot more difficult to automatize (at least for the people who don’t program in Java, like me).
One of the protocols I wanted to automatize in Cytoscape was to plot different measures applied to the nodes of the same network, and export an image (along with the legend) of it automatically. For example, I wanted to calculate different measures of node centralities to a network with Centiscape, and then plot a figure for each measure and save it to a file.
I’ve finally managed to automatize this when I discovered the XMLRPC plugin for Cytoscape. I have learned a lesson: if you want to automatize anything in Cytoscape, with any programming language other than Java, then use the XMLRPC plugin. There is also a Python Console plugin for Cytoscape, but I recommend you to use the XMLRPC directly. It is better documented (I couldn’t find any documentation for the Console plugin), you can launch it from a bash terminal, and if you use ipython, you have name completition. Moreover, the XMLRPC protocol is more standard than the Cytoscape’s inner python console, so you will also learn something useful from it.
So, if you want to see an example of how to automatize Cytoscape with python, or want to compare different measures of node centralities on a network, you can use access a repository called ‘Cytoscape compare node centralities’ I set up on bitbucket. The code can also be used as an answer to one of the most pressing problems that affect Cytoscape users: export a network view along with its legend.